
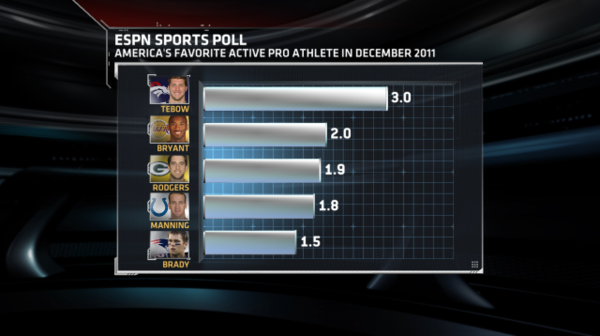
Bar graph: A diagram in which numerical values of variables are represented by the height of or length of the rectangular lines.
Bar graphs are used a lot. Not just in math but in everyday things with sports to business companies dealing with data.
Here are some simple steps to start a bar graph.
Step 1. First you need figure out a title for your bar graph
Step2. Then you plug in the information for your graph and when you make your bars make sure they don't touch because that is a histogram.
Pretty basic when it comes to making a bar graph.
great technique! I love the pictures and story behind the graphs it makes it easier to learn.
ReplyDeletedom,
ReplyDeletei like the image you used as an example for a bar graph. i feel like your step by step explanation could have used some more detail, but good attempt.
professor little